Board, Costs and Finance Reporting
Build your own reports and dashboards, and automate your reporting of key financial data with Power BI in Maritech Analytics.
Too time-consuming, you say? Yes, we know. Reporting can demand a lot of your hours and energy. Especially when you have to collect a lot of the information manually, over and over again.
To help you out, our data science team has created a set of tools and templates tailored for your reporting tasks. For example, you can now automate your Management and Board reports, Quarterly/yearly reports, KPI Dashboard, Reporting on group, departments or projects, Cost Analysis reports, Balance dashboards, Customer reporting on credits and payment status and Currency exposure reports. Sounds nice, right?
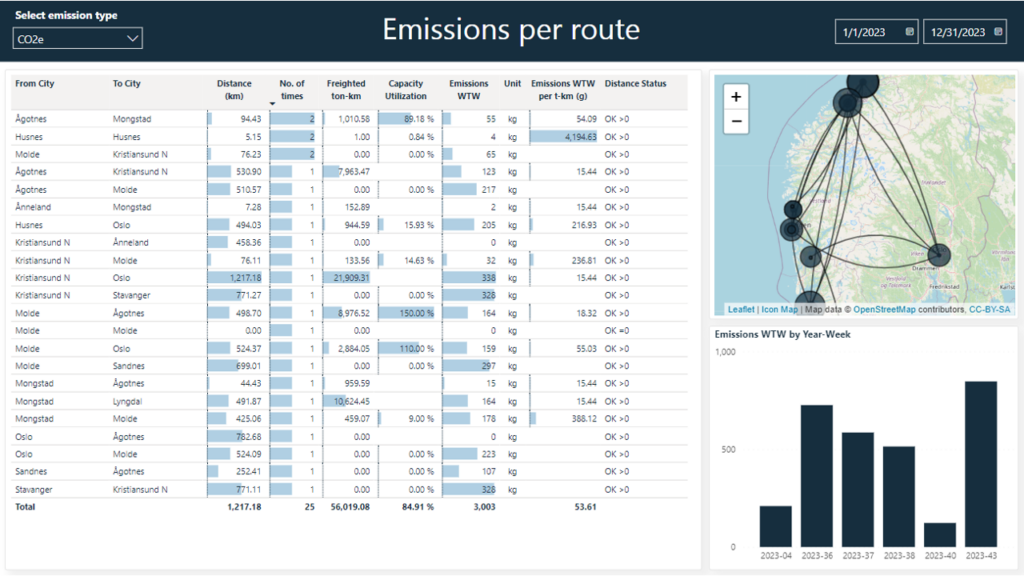
Below, you can read more about some of the finance reporting tools – here you can also get to know our new Customer and Seafood Market Insights reports. And – if you are managing a logistics company, we have some treats for you as well. Learn more about how you can use Maritech Analytics for e.g. sustainability reporting tool and dashboards visualizing capacity utilization, delivery precision, transport corridors and more.
Finance report
We can help you automate your reporting of financial data from all major Accounting & Financial Management Software providers including 24SevenOffice, Xledger, PowerOffice, and Visma.
Our finance reports include reporting on:
- Results on group, department and project level
- Balance dashboards
- Customer reporting on credits and payment status
- Currency exposure reports
Board Report
A good Board Report presents all necessary information with balance and objectivity, in an easily understandable format.
With our new Board Report tool you get:
- Yearly financial KPIs
- KPI’s and trends on each fish species and product categories
- KPI’s and trends on each markets
- Insights of purchase and sales prices comparing with Nasdaq and SSB prices
- Goals for budget
Facts instead of assumptions
Seaborn is one of the leading exporters of salmon and trout in the global market, and has used Maritech Analytics as strategic decision-making tool since 2019.
The analytics platform gathers and visualizes data from all relevant data sources, enabling Seaborn to improve processes, profitability, and reduce time spent on searching for data and preparing reports.
“Maritech Analytics provides us with better insights and understanding of our data.”

Cost Analysis Report
How do you manage your internal and external costs? Which customers or items should be put as targets to reduce costs?
Cost analysis can be crucial for your company’s decision making processes; to know, rather than assume, which actions and adjustments you need to make. And to help you determine if a project is likely to be profitable, before you get started.
With our Cost Analysis tool you get:
- KPI’s on different cost types
- Overview of internal and external costs patterns
- Insight into each cost type to find key influencers
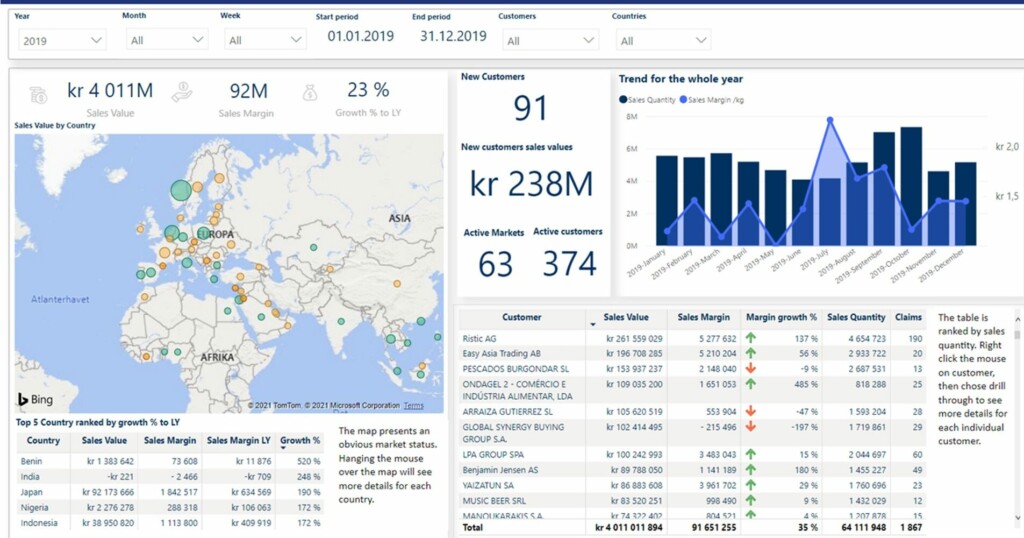
Quarterly/Yearly Report
How is your sales margin going on yearly or quarterly? Which customers or items perform best or worst? Does your sales margin/kg and sales price go well compared with Nasdaq?
A quarterly report gathers all your financial documents and helps you keep track of the financial condition of your company. With our Quarterly / Yearly report, you can easily assess how your company has performed in the last quarter / year and can take action to change course if necessary.
With our Quarterly Report tool you get:
- Yearly and Quarterly financial KPIs
- Insights and trends on how customers, suppliers, countries and items performed
- KPI’s with Nasdaq price
KPI Dashboard
Which items and customers can increase your profitability? What is the utilization levels for your warehouses?
A KPI dashboard displays your chosen key performance indicators in a simple visual view. This gives you a quick overview and gives you support in your decisions. You always have control over your company’s performance and can control them against your company’s strategic goals.
With our KPI Dashboards tool you get:
- KPIs for costs
- Insights of price sensitivity on item and customer
- KPI’s on warehouse
- Tools for checking product age in the inventory
Curious? Let us know!
We would love to talk to you.