Revealing the value
They have a passion for data, and one goal in mind – helping our customers turn their data into profitable insights.
Get to know our Data Science team!
Forecast, improve, optimize
How do you prepare strategic decisions and daily priorities? How much time do you spend (or waste?) creating reports, collecting data from different sources?
Are ad hoc, Google sheets, Excel and way too much words that come to your mind? Then you are not alone. Most companies have untapped profitability potential related to data analytics.
Ten years ago, Harvard Business Review described the Data Scientist profession as the sexiest job of the 21st century – “A key player in the organization” and “a high-ranking professional with the training and curiosity to make discoveries in the world of big data science”. The profession and title was still in its early days, according to the same article, it was first used in 2008. As we are entering 2022, Data Science has already been one of the global mega-trends for several years, and The World Economic Forum predicts that data scientists and analysts will become the No. 1 emerging role in the world by 2025.
So, how does this affect the company you lead or work for? And – how to get started? You do not have to do it alone, and there is no need to re-invent the wheel.
Challenge the experts!
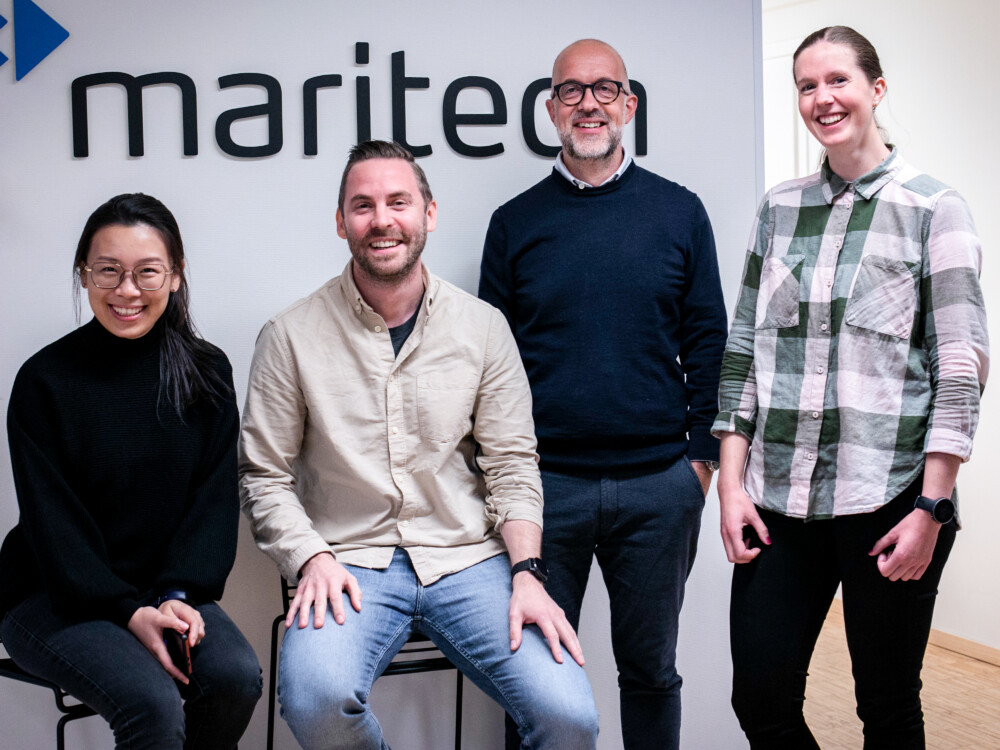
In Maritech, Data Science has been one of our core strategic areas since 2018, when we launched DGS Analytics – a Microsoft Power BI-based application in our Maritech Cloud platform. Since then, we have created an Analytics portfolio of tools and reports tailored for seafood and logistics, and built a strong team of highly skilled experts. Ting Chao, Kristoffer Heggdal, Oddvar Husby and Yngvild Neset (from the left) are some of the team members at our Molde office.
“Our main mission is to give our customers insights and understanding of the enormous amounts of data they have”, says Oddvar Husby (PhD), VP Data Science in Maritech.
Analytics tools + reports, projects and trusted advisors
What we do for our customers related to data science, can be divided into three main categories; standardized tools in Maritech Analytics, advisory services, and specific customer projects.
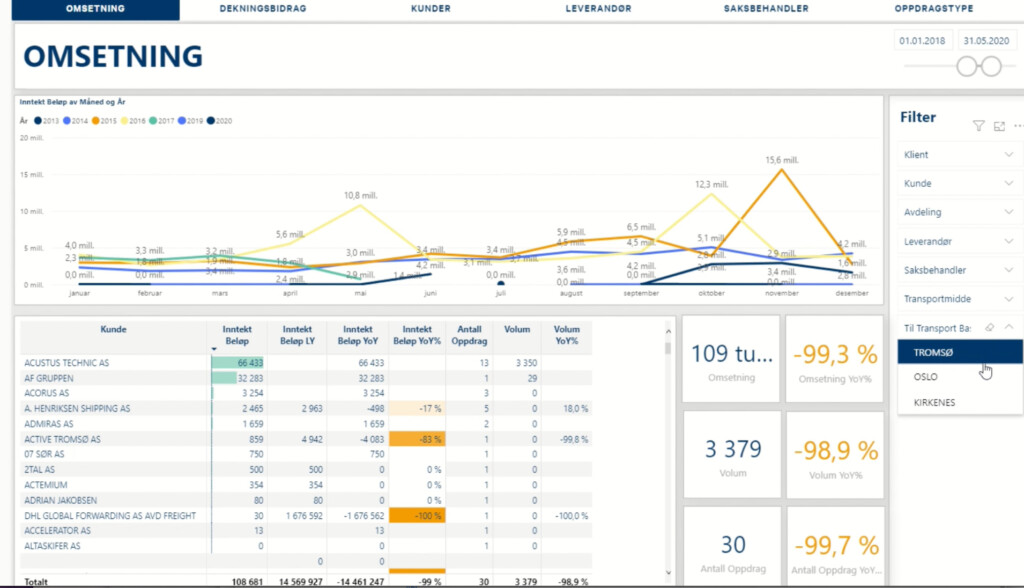
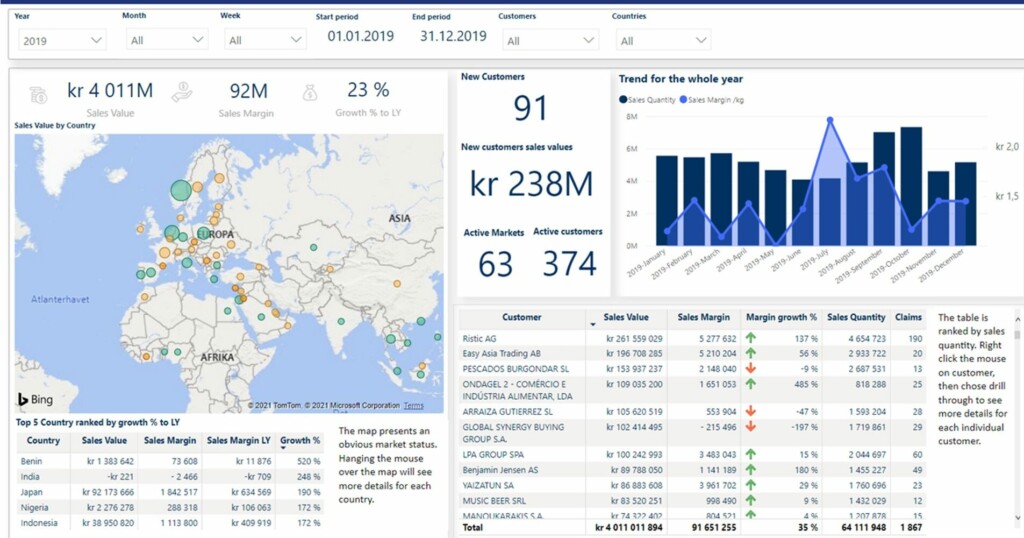
The Analytics tools can also be divided in three – seafood, logistics, and common. Examples of tools tailored for seafood are salmon and cod market reports, customer reports and Analytics as a standard feature in our trading software DGS Purchase & Sales. For logistics companies, examples are our new sustainability report, and dashboards visualizing capacity utilization, delivery precision and transport corridors. In addition to these, we also offer e.g. board reports and finance reports, to mention some which are not industry-specific.
“Our team consists of people with different backgrounds and experience from various industries around the world. What is common is the deep understanding and knowledge of our customers’ processes, markets and workflows, and the urge to help them turn data into valuable knowledge. And – we all love a challenge. So do not hesitate to let us know if you are curious – or would like to work with us. We are always looking for new talents.”
Data analyst Kristoffer Heggdal joined the team in June 2021. He holds a Master’s degree in Economics from The University of Malaya and is especially interested in financial analytics and reporting. Kristoffer highlights the close collaboration with customers as one of the most exciting parts of his job.
– I enjoy working with our customers and developing reports that are truly useful for them, helping them gain more knowledge and improve their operations. We can help customers with better reports, cost control, monitoring accounts receivable and balance reports, to name a few.

Combining data in Power BI
Data Analyst Yngvild Neset also joined our Data Science team in June. She holds a Master’s degree in Mathematics and Physics from NTNU and has worked as an analyst in several Norwegian companies before she moved to Molde to work for Maritech.
“By combining data from different sources and through advanced analytics we enable our customers to predict the future – and the results speaks for themselves. I find it very motivating to help our customers achieve their goals. And showing them that using Power BI in Analytics is easier than they may assume.
Many companies run heavy manual processes to compare data, without knowing that it can be quite simple to start using new and far more efficient tools. Power BI saves you a lot of time and energy, and is one single source of truth. Through manual processes, you can potentially end up with many truths”, Yngvild says.

Sustainability reporting
Ting Chao has two years’ experience as a Data Analyst in the Data Science team in Maritech. Her impressive CV includes two Master’s degrees from England and Norway, as well as work experience from the Food Science Institute in China and at the Logistics Institute at Molde University College.
“We see a big potential related to use of data in the seafood industry and within logistics. We understand the market and can help customers predict, increase sales and reduce their costs,” says Ting, who lately has been spending a lot of her time developing Analytics for Logistics, including the new sustainability reporting tool tailored for the logistics segment.
“Now the logistics customers can easily get an overview of core cost drivers, vehicle efficiency, utilization, transport corridors and environmental impact. Data can be used to optimize their workflow and enable to measure and document the effects of all adjustments – in terms of time, money and sustainability. Highly motivating for us as well!” she smiles.
Curious? Let us know!
We would love to talk to you.